Mapping rough roads with a phone
We tested if a phone and a cheap engine adapter can replace costly vehicle loggers, with an app that records the road and a server that maps rough stretches.
A phone full of sensors
Fleet operators, road maintainers and vehicle builders all want to know where the roads are bad and what the vehicle was doing there. The usual answer is a dedicated logger in every vehicle, which costs money per vehicle and keeps the data inside a closed box. Yet every driver already carries a phone with motion sensors and GPS, and a plug-in adapter for the car’s diagnostic port costs a few euros. In August 2026 we built a prototype to find out whether that is enough.
From a web page to an app on the phone
The first logger ran in the browser and installed from a web page, with nothing to download from an app store. Its limits showed quickly. On the phone we were testing with, a web page gets very little sensor access once the screen locks, and it can barely talk to a wireless adapter. The web logger stayed as a fallback, and a native app took over. It keeps recording with the screen off.
Teaching the app what smooth feels like
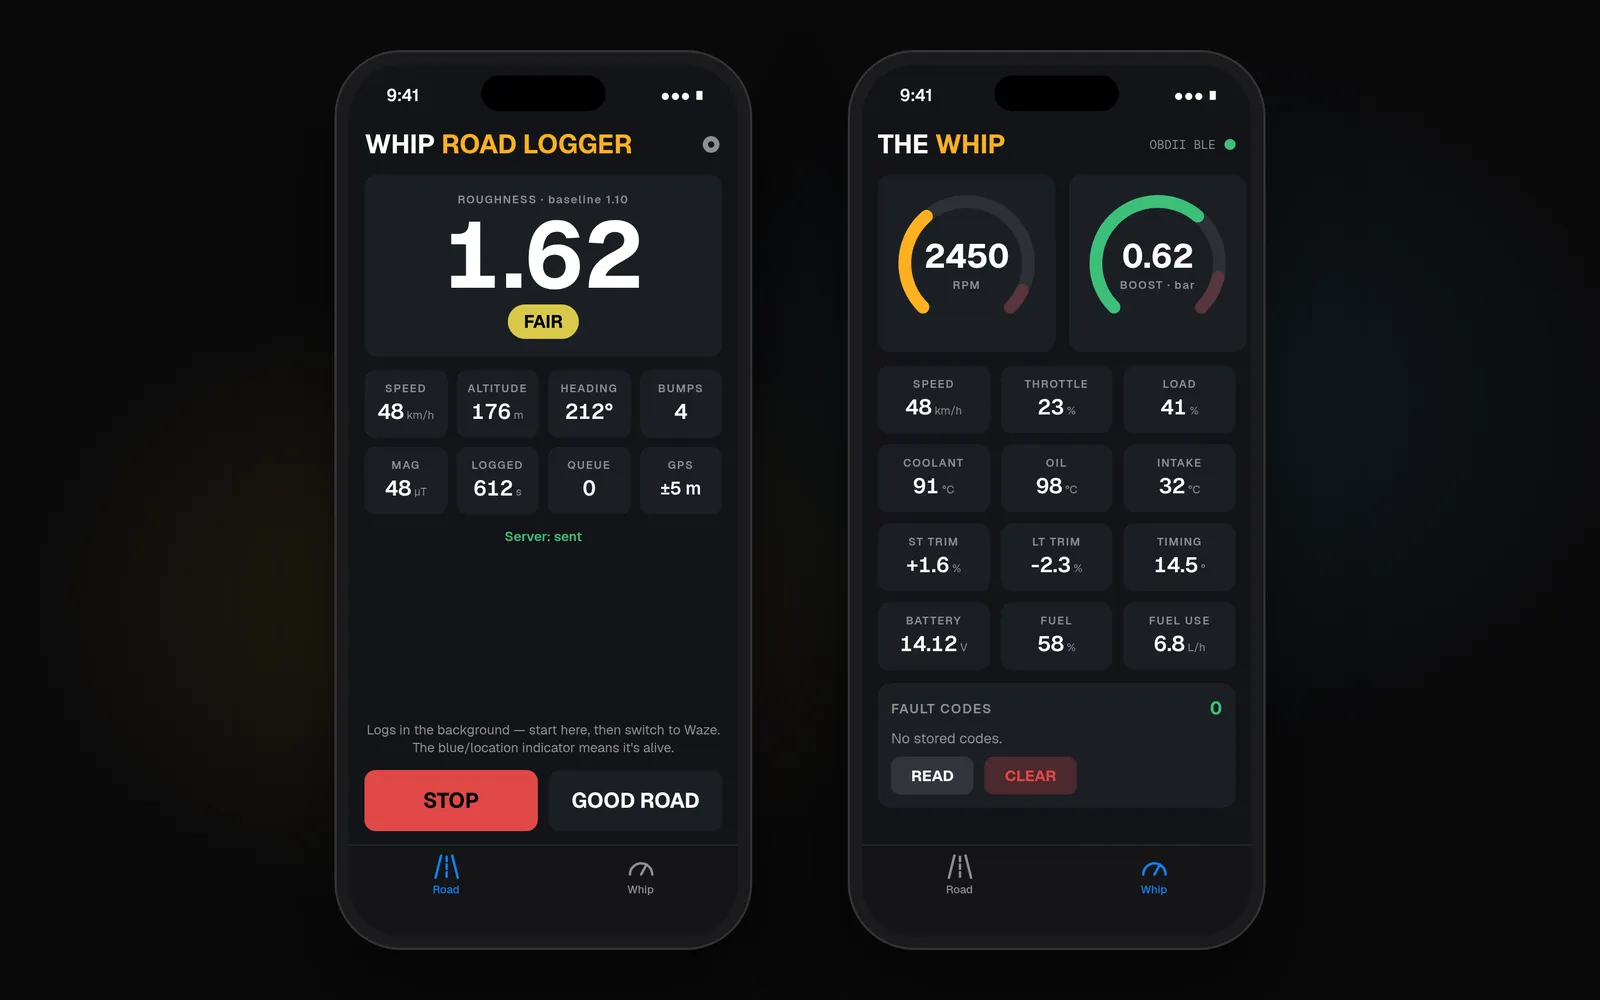
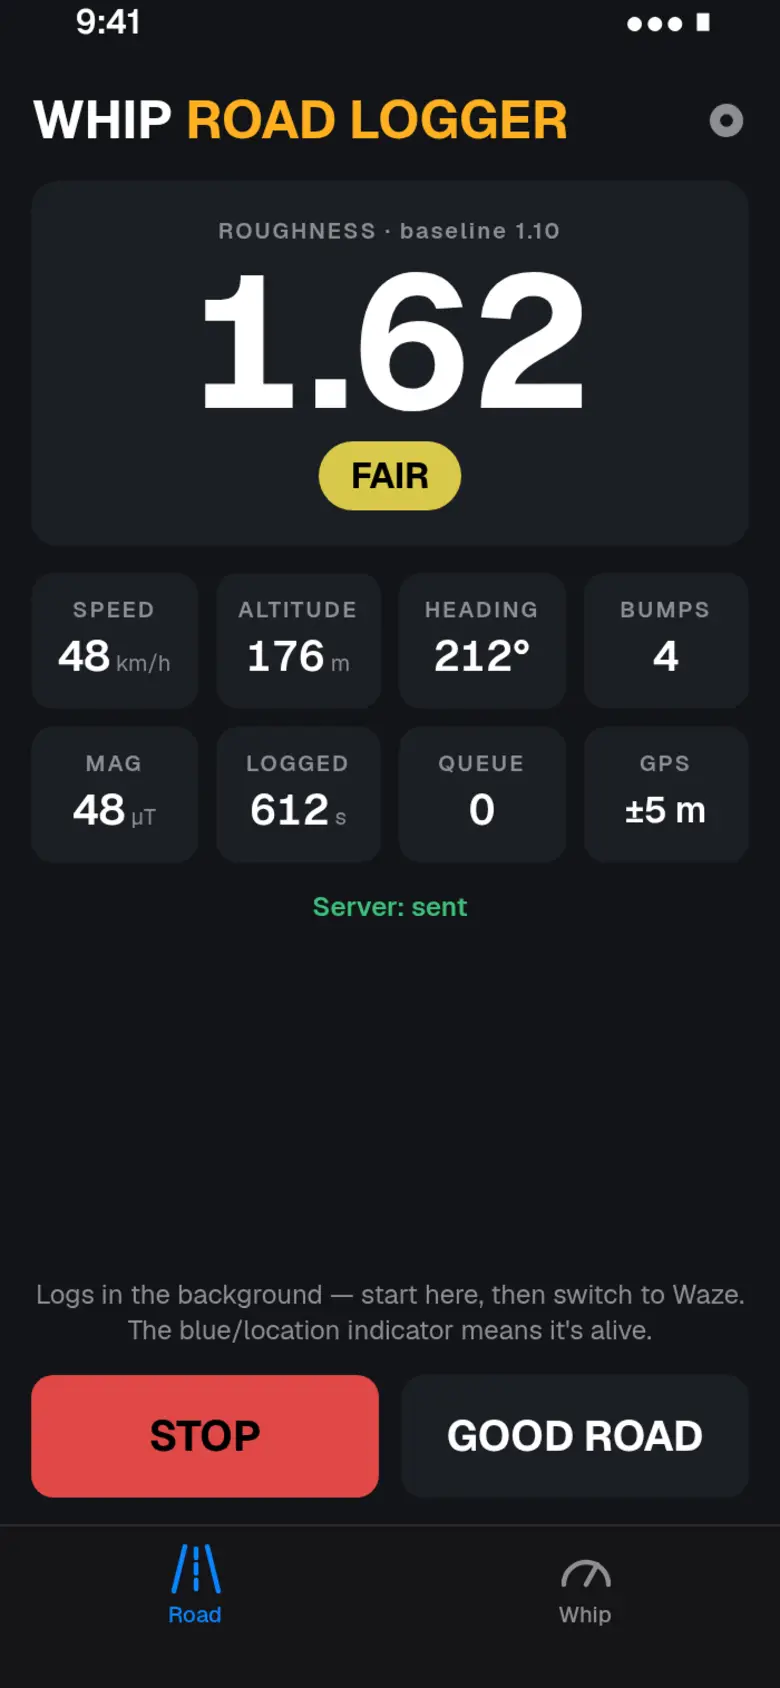
The app reads the phone’s motion many times a second and boils each second down to a few values: how hard the car shook up and down, the biggest jolt, how it turned, and where it was and how fast. Only those per-second rows go to the server. Uploads stay small, and they can wait out a patch of bad signal.
Every car and every phone mount shakes differently. So before logging, the app measures a baseline on a stretch the driver knows is smooth, and the four grades (smooth, fair, rough and bad) are set from that. The trigger for a bump scales from it too. Sharp spikes are saved as separate bump points with the place and the speed. When the car stands still, the app also records the main frequency of the vibration, which hints at how the engine and its mounts behave.
The engine joins the same rows
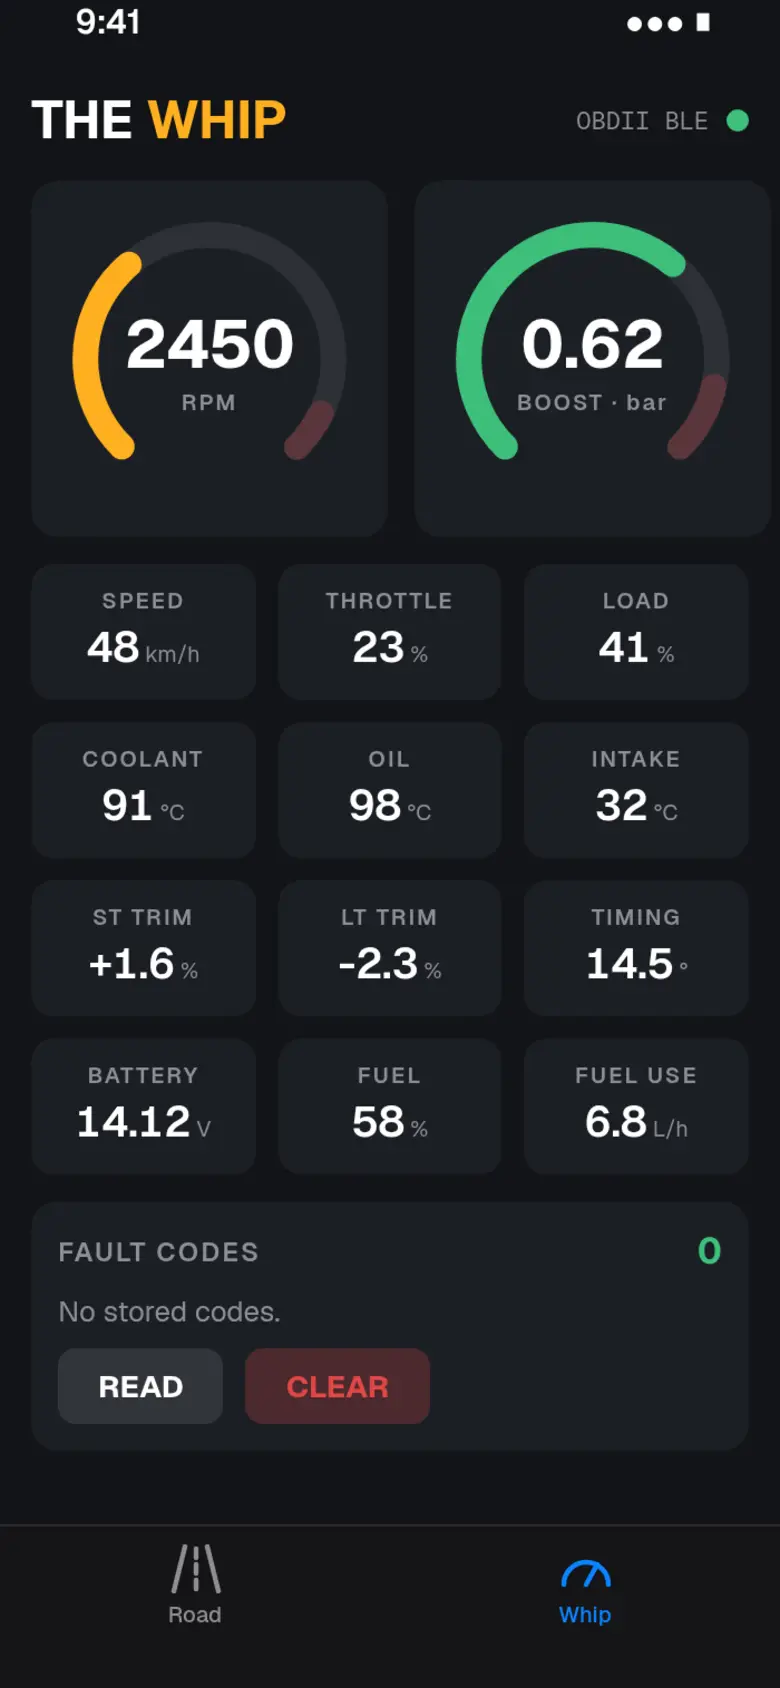
A second screen, which we called The Whip, reads the car’s diagnostic port through the cheap wireless adapter. It shows engine speed, road speed, throttle, engine load, boost and coolant temperature as live gauges, and writes them into the same per-second rows as the road data. A rough stretch can then be read next to what the engine was doing on it.
A map the server draws by itself
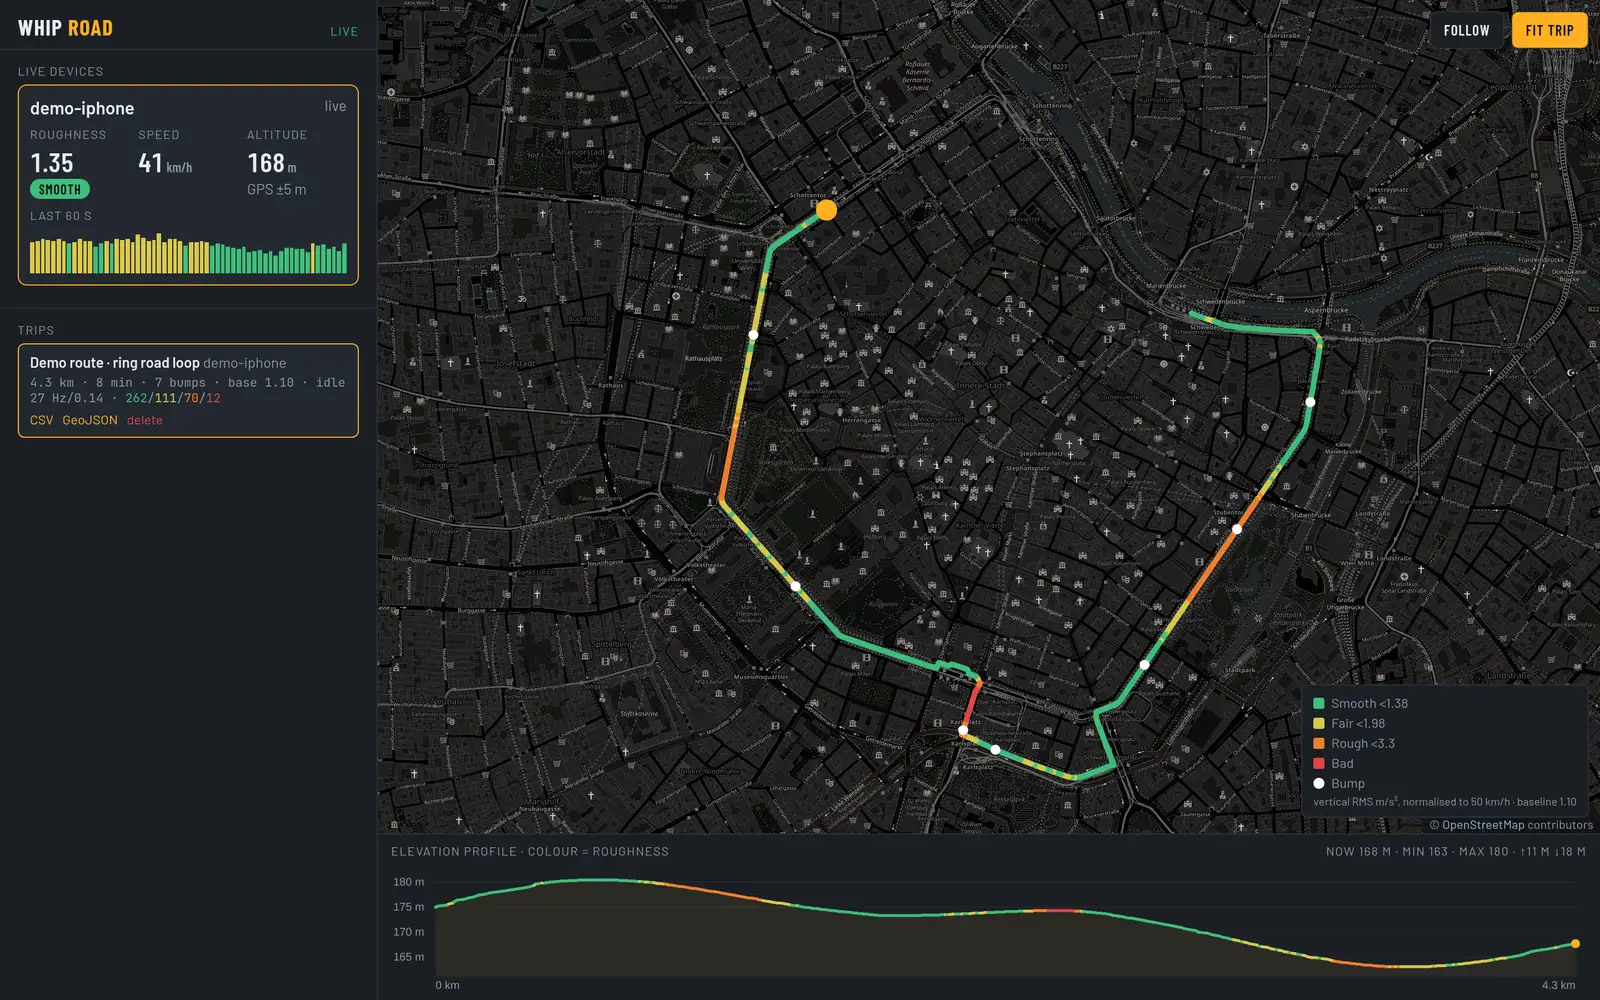
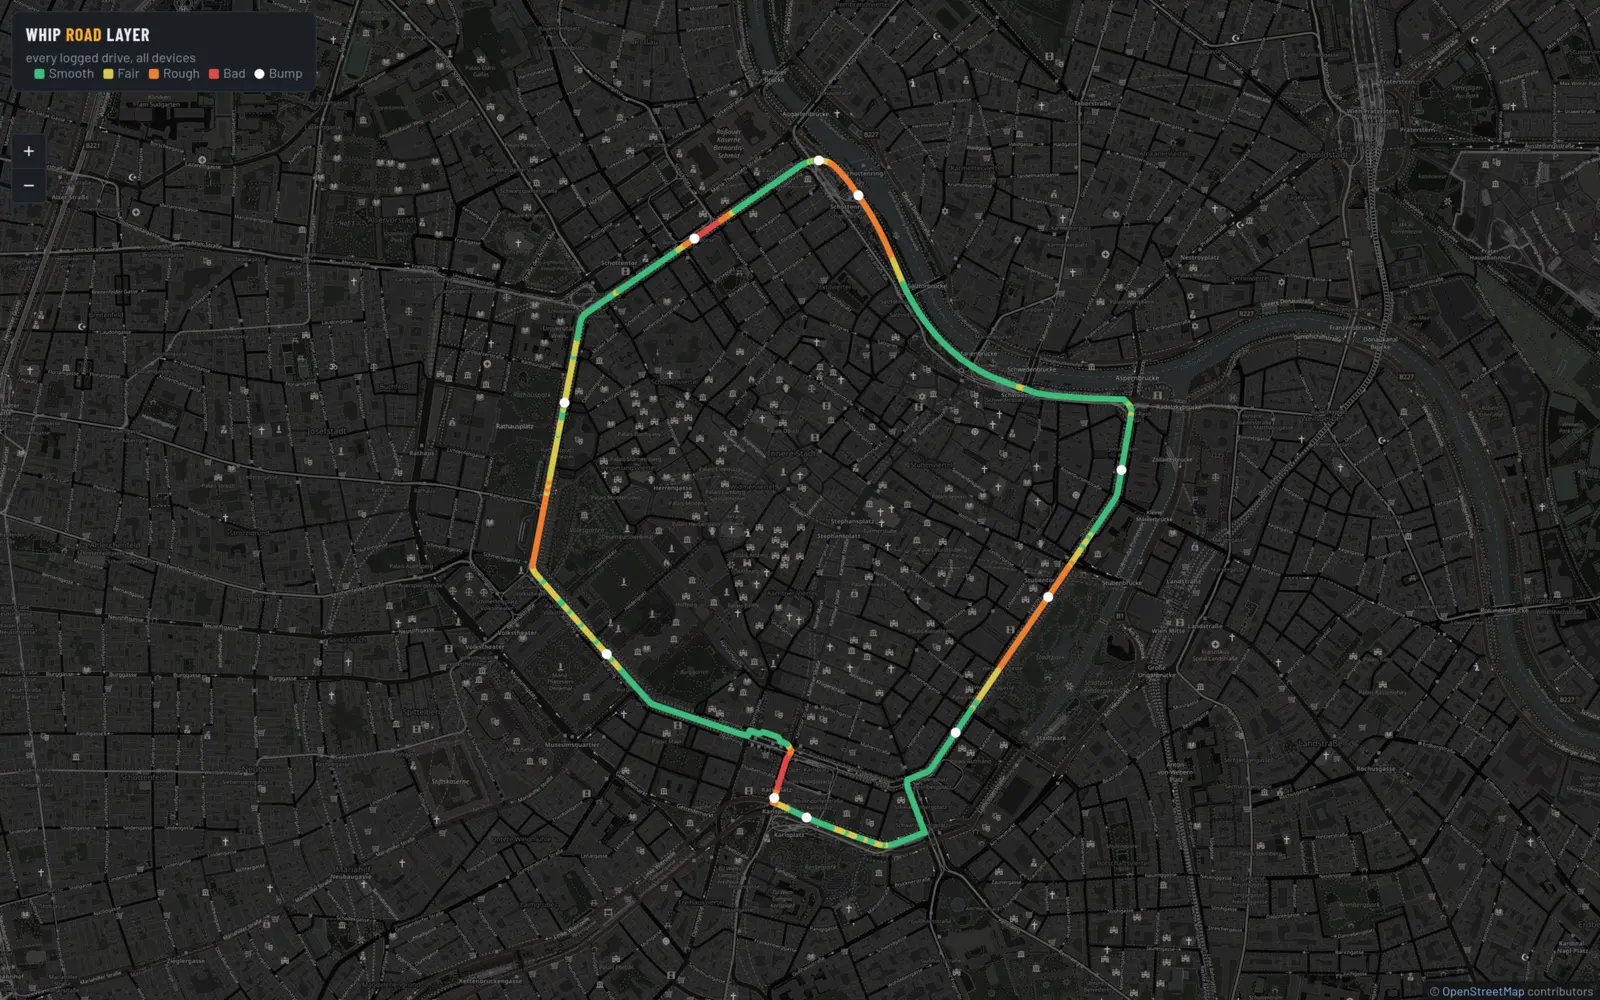
The server was kept small on purpose, with no outside packages, and it stores every trip as a plain file. Live positions go out to a dashboard while someone drives. For the map we skipped the heavy mapping software that usually does this job. The server draws its own see-through map tiles instead, with each logged second colored by grade and bumps shown as white dots, and redraws them every few minutes. Any trip can be exported as a spreadsheet file with every channel, or as a map file for mapping tools.
The first three drives were logged on 23 August 2026, and the whole chain held up from phone to map. It is still a prototype. For us it settled that we can build a phone app that talks to vehicle hardware, together with the server and map that sit behind it.
Screens
On the phone
Keep reading